
A sudden cooling system failure at night can put entire shipments of high-value frozen goods at risk of spoilage. This risky situation is always a major concern for cold storage managers and food production managers.
Manual temperature control using hourly logs often leaves dangerous data gaps. We need an automated solution to ensure data continuity and perfectly meet quality control requirements.
This article provides the legal basis according to Codex standards and a solution using Japanese mechanical charting equipment. The intelligent system below will help your business’s cold supply chain operate with absolute safety.
.jpg)
1. Codex Standards on Cold Storage Temperature Control
1.1 Legal Constraints in Cold Chain Management
Good control of dynamic factors plays a crucial role in the safe preservation of food. According to the strict regulations in Sections 9.2.4 and 13.2.1 of Codex CXC 1-1969, we must provide adequate refrigeration, freezing, and effective temperature monitoring. Continuous monitoring is mandatory in areas where temperature directly affects the safety and suitability of the product.
Cold chain management systems need to take into account the physicochemical nature of food, such as water activity (aw) and pH. These parameters directly impact the ability of spoilage microorganisms to multiply and produce toxins. Therefore, maintaining a stable temperature range helps the facility effectively prevent significant biological hazards.
1.2 Equipment Calibration and Validation Requirements
All instruments recording temperature changes in the factory must ensure measurement accuracy. HACCP guidelines stipulate that temperature monitoring and recording equipment must be checked and calibrated periodically. It is the management’s responsibility to maintain the integrity of technical records before the competent authorities.
Storing narrow-range calibration data helps the QA department demonstrate its ability to continuously control hazards. This ensures that stored food batches always have the highest usability and legal validity. This is a mandatory technological hurdle for businesses aiming for export standards.
2. Operating Principles of Mechanical Temperature and Humidity Recorders
2.1 Specialized Bimetallic and Hair-Type Sensor Mechanism
The purely physical sensing method provides superior reliability for cold storage environments. The device utilizes the temperature-dependent expansion and contraction of the bimetallic strip to convert it into mechanical motion. Simultaneously, the size change due to humidity of the specialized hair fiber is also directly transmitted to the lever arm.
This mechanical lever mechanism controls the ink needle to continuously draw physicochemical changes on the chart surface. The recording cycle is completely automatic without the need for complex digital processing circuits. Therefore, we can completely eliminate pulse errors caused by electromagnetic pulses.
2.2 Quartz Rotating Drum and the Visuality of Chart Paper
The mechanical storage system uses a paper chart rotating drum operated by an independent quartz actuator. This actuator is powered by ordinary AA batteries, completely isolated from the factory’s mains power. The device rotates the drum steadily to draw the ink needle in a 1-day or 7-day cycle.
Continuous ink lines displayed on the drawing paper allow warehouse managers to visually monitor environmental conditions. You can quickly detect temperature fluctuations with the naked eye at any time during a shift. This solution simplifies the recording system and facilitates easy information exchange with personnel.
.png)
SK Sato temperature and humidity chart recorders are distributed by Duc Duong
3. Technical Specifications of the Sato Sigma II Temperature and Humidity Chart Recorder
3.1 Industrial Standardized Temperature and Humidity Measurement Range
To standardize quality control in the cold chain, businesses need specialized hardware. Currently, the Sato Sigma II temperature and humidity chart recorder distributed by Duc Duong is the optimal solution. The device fully meets the core technical specifications of SK SATO Japan.
This model has a temperature measurement range from -15°C to 40°C and a relative humidity measurement range from 0 to 100% RH. The narrow measurement error of the device is extremely small, ensuring high consistency for test results. This durable configuration strongly supports the monitoring cycle of cold and frozen food storage.
3.2 Anti-condensation Protective Casing Construction
The device body is protected by a high-grade acrylic plastic casing, resistant to high humidity and continuous adhesion. This construction prevents frost and condensation from entering the mechanical chamber. The included consumables list includes standard graph paper and specialized ink needles.
The lines drawn by the needle remain fine, clear, and smudge-free even in low temperatures. The smooth operation of the system minimizes the need for frequent maintenance in the mechanical room. This is a reliable hardware choice for large-scale food warehouses.
The lines on the SK Sato temperature chart recorder are clear and easy to read
To establish a synchronized SOP process for controlling critical limits (CCP) and to receive guidance documents on calibrating handheld optical temperature ranges, customers can leave their information for in-depth consultation in the Contact Form of Duc Duong Company for the fastest support from our specialists.
4. Data Blocking for QC Data When Cold Storage Experiences Power Outages
4.1 Weaknesses in Signal Dropping of Electronic Data Logger Systems
Wireless electronic data loggers rely entirely on grid power or radio waves. When the factory system experiences a main power outage, the centralized monitoring network will stop recording. This creates data gaps, causing serious disruptions to technical records.
If temperature deviations occur during a power outage, you will lack evidence to verify quality. Inspectors cannot determine whether the critical limit of HACCP has been violated. As a result, businesses are forced to isolate the shipment to prevent unsafe food from reaching consumers.
4.2 The evidential value of independent mechanical paper charts
The Sato Sigma II paper chart recorder acts as a safety barrier for the QC room. Because it operates on an independent quartz battery, the machine continues to plot the temperature and humidity curve even during power outages. The mechanical expansion and contraction mechanism of the bimetallic strip accurately records all internal temperature fluctuations.
The rough paper chart provides objective evidence to help us analyze the root cause. The QA department can easily determine how much the temperature slope increased during the incident. This document is the scientific basis for taking appropriate corrective action according to standards.
5. Techniques for positioning temperature recorders in cold storage
5.1 Thermal Stratification
The physicochemical nature of cold air always creates significant challenges for temperature control. Due to their higher density, cold air always sinks closer to the floor surface of the storage warehouse. Conversely, warmer air convection rises, causing thermal stratification.
The temperature difference between the ceiling and floor of the warehouse creates complex areas of heat accumulation. Areas near entrances are always at risk of cold pressure drops due to workers entering and exiting shifts. Therefore, precise measurement point positioning is essential to avoid local system errors.
5.2 Standards for Positioning the Measuring Device
To ensure that the data obtained accurately reflects the actual state, you need to adhere to the positioning principles. The SOP tracking device must be fixed at eye level for the operator. The ideal position is approximately 1.5 m to 1.8 m from the factory floor.
We absolutely must not install the device directly under the air outlet of an industrial air conditioner. This position causes the probe to receive a lower heat level than the actual value, distorting the results graph. The QC department should perform a comprehensive heat map validation cycle before installing the device.
6. Calibration of the Temperature and Humidity Measuring Device to Achieve ISO 17025 Certification
6.1 Measurement Traceability Chain to the SI Unit System
All data stored on graph paper must have calibration certification to achieve legal validity. The bimetallic spring sensor system of the Sato device must establish measurement traceability. This continuous chain helps link factory measurement results to the international SI system of units.
The equipment is periodically placed in a standard microclimate chamber for comparison and standardization. Narrowband testing records detailed system measurement errors to correct the mechanical algorithm. This measurement standardization helps the factory’s HACCP records consistently pass quality audits.
6.2 Industrial Deep Freezing Range Calibration Cycle
For industrial deep freezing environments, equipment calibration frequency needs to be strictly enforced. Technical experts recommend maintaining a calibration cycle of once every 12 months. The temperature range for measurement must cover the actual operating range from -20°C to 5°C.
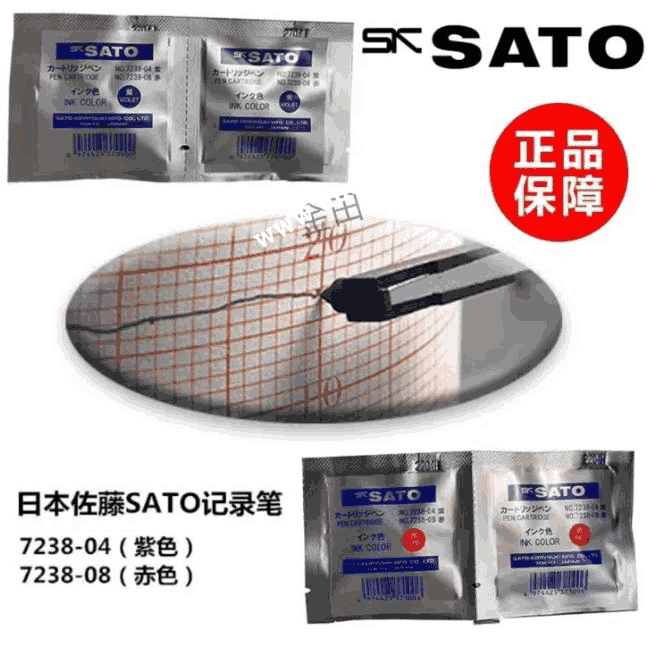
Duc Duong Company provides a complete high-quality calibration service package for food businesses. We have a readily available supply of consumable accessories including 7-day drawing paper and Japanese ink cartridges. Hardware synchronization ensures the continuous and stable operation of the factory’s monitoring cycle.
Conclusion
In summary, the application of automated cold storage temperature recording solutions plays a crucial role in protecting food quality. Businesses need to strictly adhere to the temperature control regulations in Section 13.2.1 of the Codex, utilize Sato’s independent roll-fed mechanical charting machines to mitigate data loss risks during power outages, and implement high-quality calibration cycles. Duc Duong Science and Technology Company is proud to be a supplier of genuine Japanese temperature and humidity measurement equipment, ready to partner with factories to optimize cold chain risk management capabilities.
To receive the complete technical specifications catalog and optimal price quote for the Sato Sigma II chart recorder configuration that meets HACCP quality management standards, please fill out the Contact Us form at Duc Duong Company or contact our measurement equipment project hotline for the most comprehensive support.
DUC DUONG SCIENCE AND TECHNOLOGY COMPANY
Address: 1014/67 Tan Ky Tan Quy, Binh Hung Hoa Ward, Binh Tan District, Ho Chi Minh City
Tel: (028) 3762 8042 – 3762 8043 – 3750 8514 – 3750 8793
Fax: 028 37628043
Email: ducduong@ducduongco.com
Website: ducduongco.com
ZALO OA: DUC DUONG SCI
FAQ
1. What are the advantages of mechanical roll-fed temperature and humidity chart recorders over electronic USB data loggers when used in food storage?
The unique advantage of mechanical chart recorders (such as the Sato Sigma II) is their absolute independence from the mains power and wireless network. The device operates based on the physical expansion and contraction mechanism of a bimetallic strip and a quartz rotating drum movement powered by ordinary AA batteries. Even if the main power supply or network connection is lost, the device continues to accurately plot temperature and humidity curves on the chart paper, completely eliminating the risk of losing original data for HACCP documentation.
2. What are the requirements of the Codex HACCP 2022 standard regarding monitoring and controlling the ambient temperature in cold storage for food?
According to Section 13.2.1 of the Codex guidelines, time and temperature control systems must ensure continuous effectiveness to prevent the growth or production of toxins by microorganisms that cause food spoilage. All equipment used to monitor and record temperatures affecting food safety must be checked for measurement accuracy and calibrated periodically or when technical needs arise.
3. Why should cold storage temperature recorders not be installed directly below the air outlet of industrial refrigeration units?
Installing the recorder directly below the airflow from the refrigeration unit will cause serious local errors. At this location, the sensor of the measuring device will always receive a significantly lower temperature than the actual temperature of the entire storage space. This leads to a situation where the digitized data is displayed incorrectly, causing warehouse managers to mistakenly believe the warehouse has reached the deep freezing range, while dead zones or high temperature stratification areas remain within the microbiological danger threshold.
4. What is the frequency of rinsing, replacing the chart paper and ink cartridges of the Sato Sigma II chart recorder?
The Sato Sigma II chart recorder (model 7210-00) allows operators to flexibly set the rotation speed of the chart drum to a cycle of 1 day, 7 days, or 31 days. For industrial food storage warehouses, replacing the chart paper every 7 days is the optimal choice to ensure sharp ink lines. The specialized Japanese ink cartridge system has a long lifespan and needs to be inspected and replaced when the lines show signs of fading or blurring due to condensation.
5. What are the core principles to consider in the temperature mapping validation process for cold storage?
The temperature mapping validation process must be implemented simultaneously across multiple points by distributing a system of control sensors at all geometric levels (floor-level, central, and ceiling-level areas) as well as at high-risk locations such as near doorways and blind spots in convective airflow. This testing cycle must be performed continuously in both empty and fully loaded states to accurately identify critical hot spots (CCPs) before locating the placement of permanent data loggers.